Description
3-Dimensional LORETA Normative Database
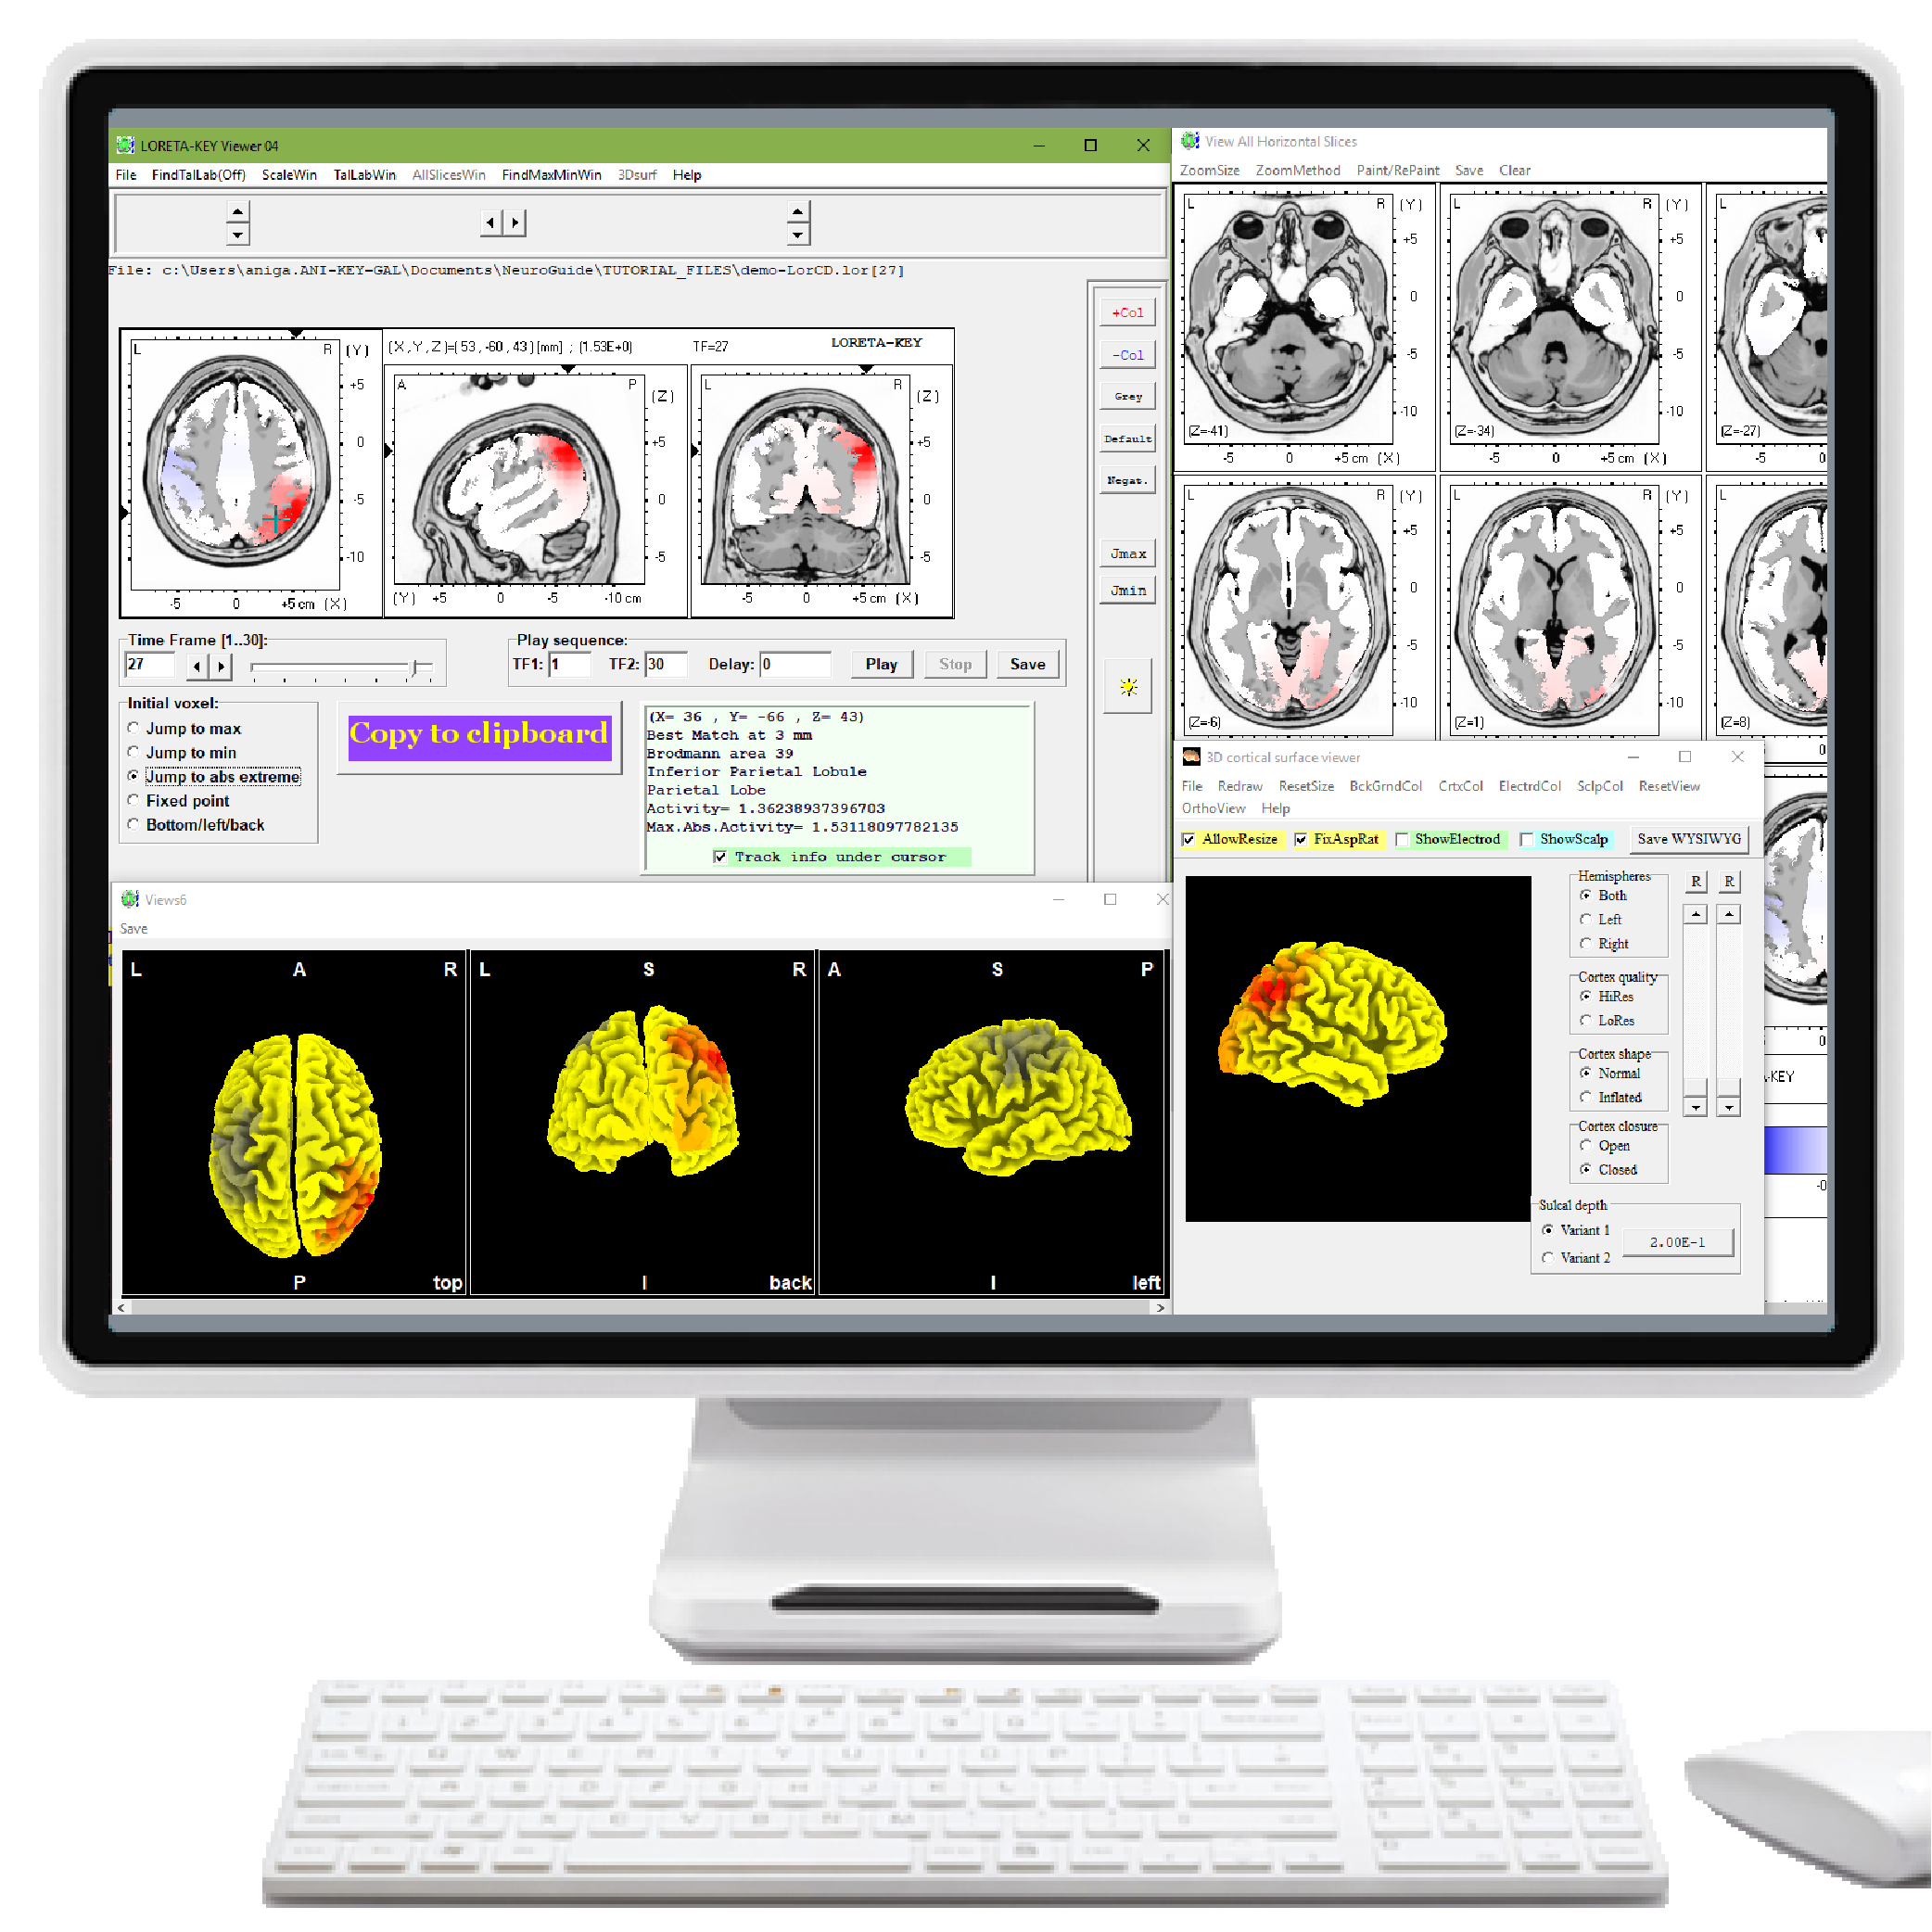
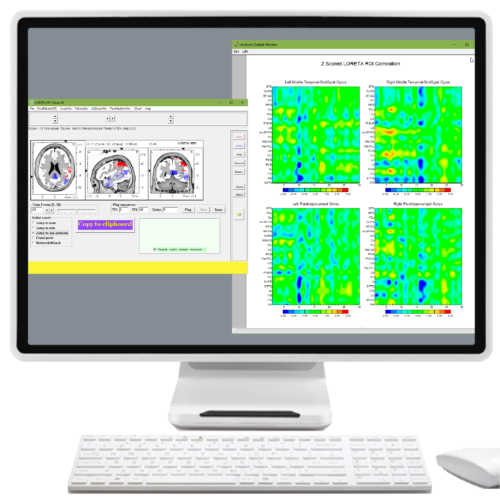
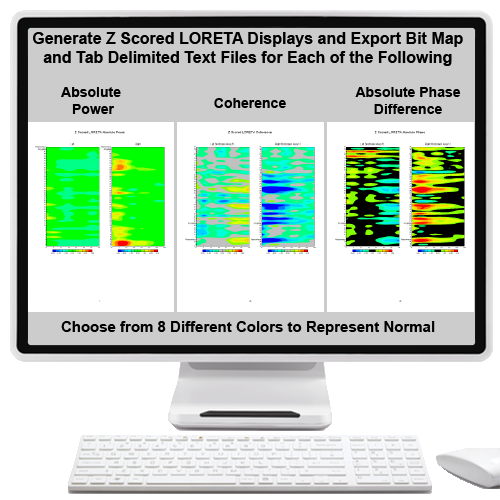
The LORETA normative database used the Key Institute’s ‘T’ matrix and cross-spectrum equations to compute the cross-spectrum of the EEG from each subject in the NeuroGuide™ normative database for each 2,394 gray matter pixel. The NeuroGuide™ software was tested by comparisons to the Key Institute software programs. After log10 transforms of the Key Institute current density values, the means and standard deviations of the 2,394 LORETA currents were computed for different age groups from birth to 82 years thus enabling a Z score to be computed for each of the 2,394 gray matter pixels and displayed using the LORETA viewer and the Key Institute cross-spectral equations. Time domain export is also available using NeuroGuide so that individual EEG events can be examined in detail in the time domain as well as to compare source localization in the frequency domain.
3-Dimensional Source Localization and a LORETA Normative Database: Birth to 82 Years
Once the Key Institute software (www.unizh.ch/keyinst/NewLORETA/Software/Software.htm) is installed on the users computer then the LORETA viewer program can be launched directly from the NeuroGuide™ edit window. See the Key Institute documentation to learn how the cross-spectrum and *.crs file is computed.

Reviews
There are no reviews yet.