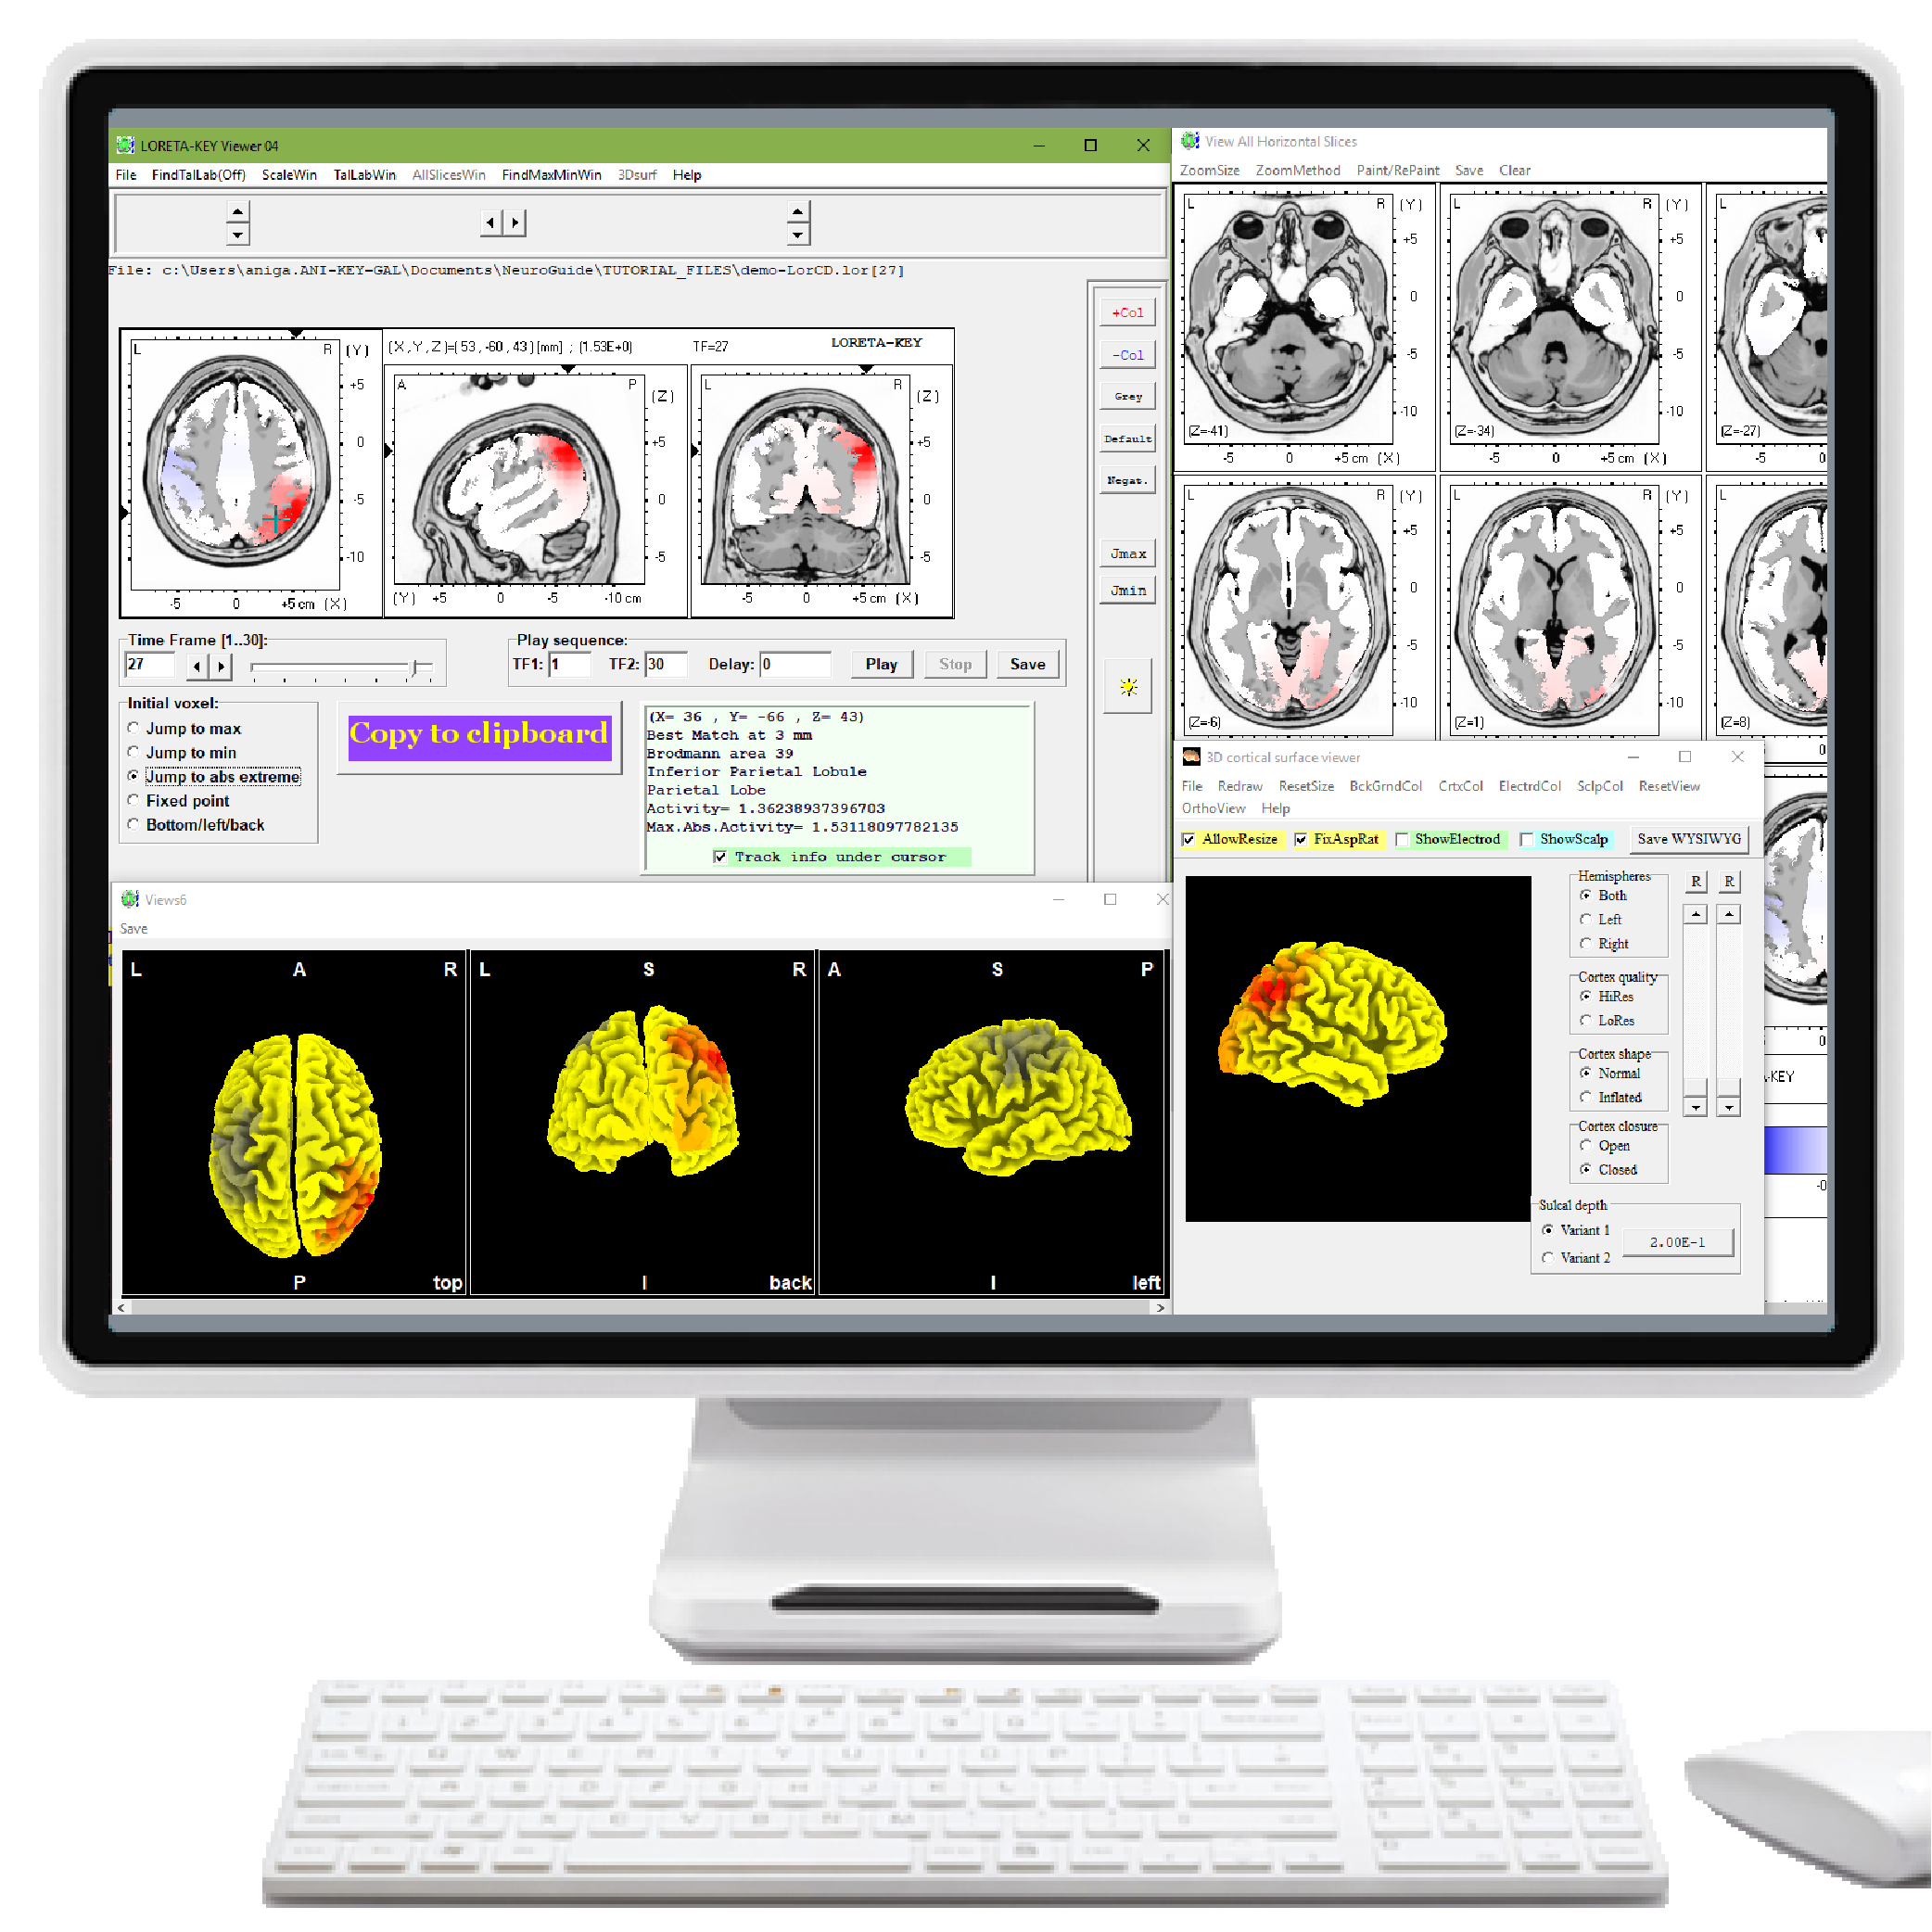
• The LORETA Current Density normative database used the Key Institute's 'T' matrix and cross-spectrum equations to compute the cross-spectrum of the EEG from each subject in the NeuroGuide™ normative database for each 2,394 gray matter pixel. The NeuroGuide™ software was tested by comparisons to the Key Institute software programs. After log10 transforms of the Key Institute current density values, the means and standard deviations of the 2,394 LORETA currents were computed for different age groups from birth to 82 years thus enabling a Z score to be computed for each of the 2,394 gray matter pixels and displayed using the Key Institute's LORETA viewer.

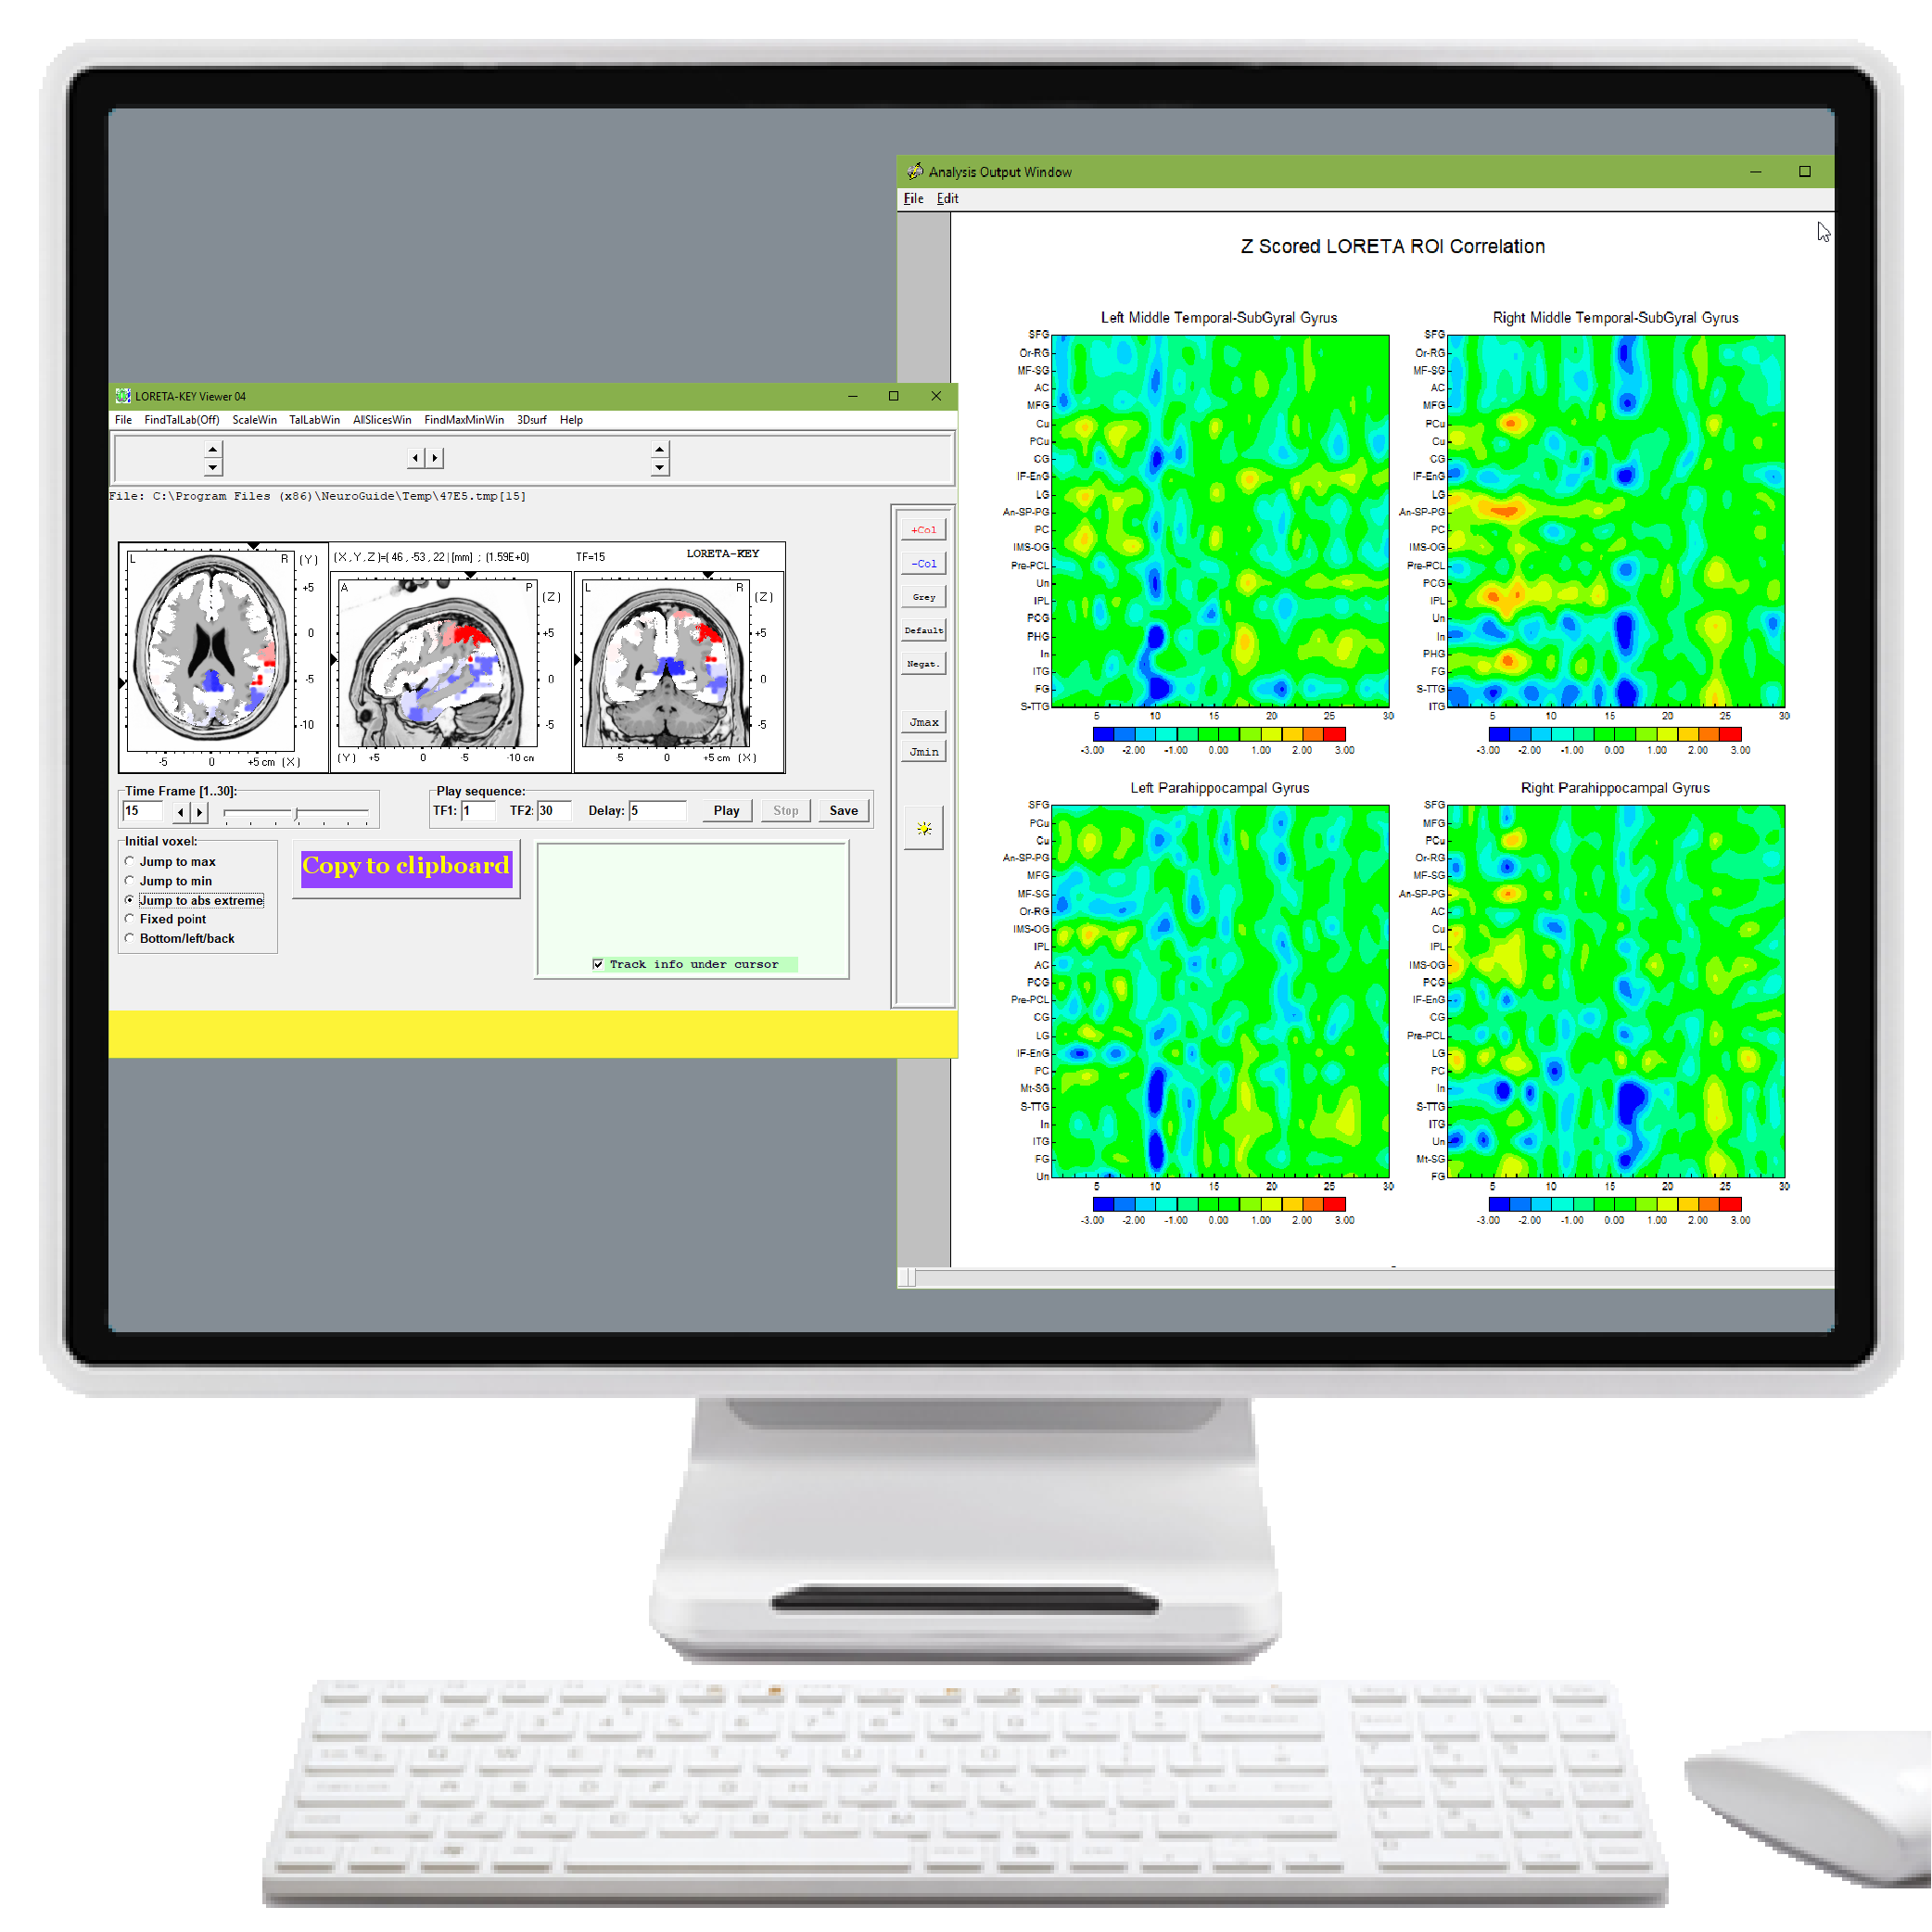
  • The LORETA Source Correlation Add-on computes the Pearson Product Correlation Coefficient (-1 to +1) with respect to a 3-dimensional Region of Interest (ROI) and the remainder of the 2,394 LORETA Gray Matter Pixels over the time span of selected EEG and then displays the results in the LORETA Viewer. The ROI is identified by either an Anatomical Name or by Brodmann Area. The average current sources of the ROI are used in the computation of the correlation coefficient and the ROI correlation to itself = 0 in the LORETA Viewer.

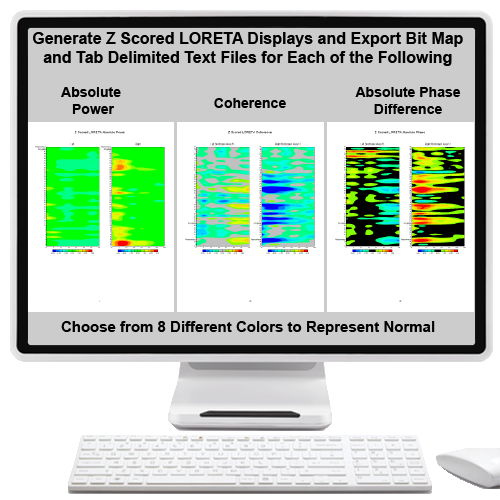
  • LORETA Coherence and Phase Differences were computed by using cross-spectral analysis of Hilbert transforms of the current sources from the center voxels of each of 44 Brodmann areas in the left and right hemisphere in eight different frequency bands.

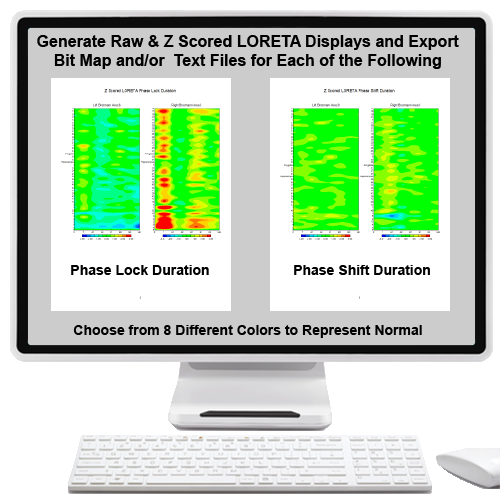
  • Generate Raw and Z Scored Bit Maps and Tab-delimited-text file for LORETA Phase Shift Duration and Phase Lock Duration.

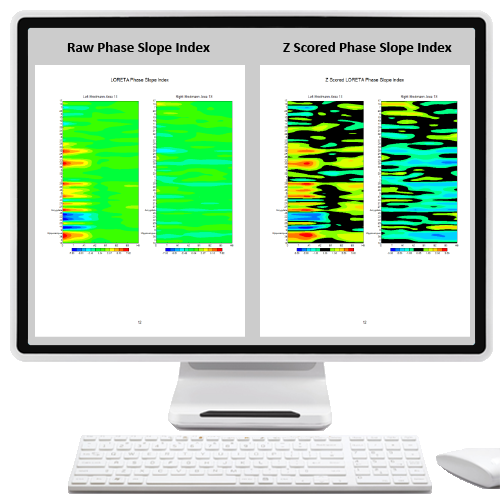
  • Purchase LORETA Effective Connectivity to generate Raw and Z Scored LORETA Phase Slope Index bitmaps and tab-delimited-text files.
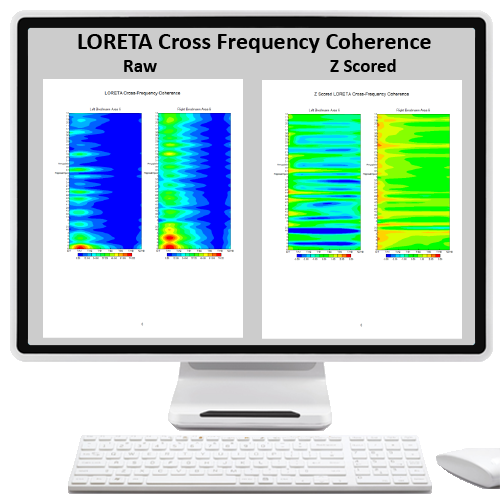
  • LORETA Cross-Frequency Coherence is anEEG LORETA measure of the Coherence (amplitude independent coupling) between frequencies and the center voxels of 88 different Brodmann areas, for example delta and beta or theta and alpha-2 or theta and high beta (Gamma), etc.  Neurons in a given Brodmann area communicates with other brain regions over a range of frequencies.  This add-on quantifies the coupling and provides a normative database comparison (Z scores) to help link symptoms to dysregulation in the brain.

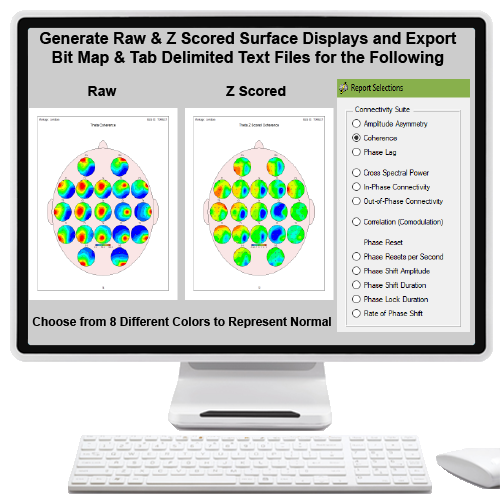
  • The Connectivity Suite is currently available is cortical connectivity from 171 electrode combinations in a single display. Use the latest techniques to analyze coherence, phase differences, correlation, cross-spectrum, co-spectrum, quad-spectrum, bi-spectrum and phase reset.

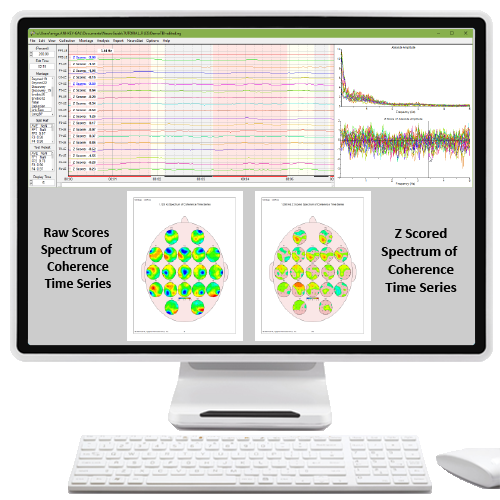
  • The Bi-Spectral analyses includes: Spectrum of the Time Series of Instantaneous Power; Spectrum of the Time Series Relative Power; Spectrum of the Time Series of Instantaneous Coherence; Spectrum of the Time Series of Instantaneous Phase Differences; Spectrum of the Time Series of Instantaneous Amplitude Differences; Spectrum of the Time Series of Phase Reset; and Cross-Frequency Power Correlation (1Hz to 50 Hz).

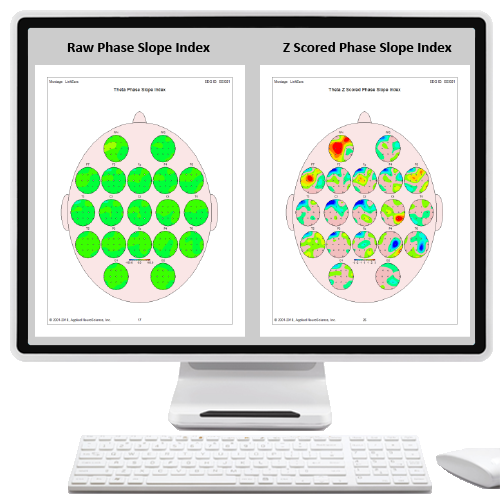
  • Purchase the Surface Effective Connectivity add-on to generate Raw and Z Scored Surface Phase Slope Index bitmaps and tab-delimited-text files.

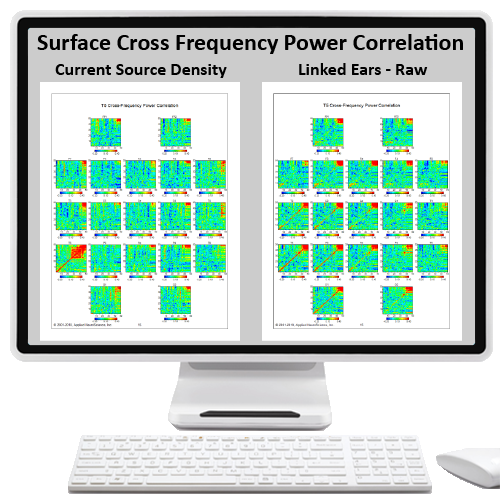
  • Surface Cross-Frequency Power is an EEG measure of the correlation of power between frequencies and scalp locations, for example delta and beta or theta and alpha-2 or theta and high beta (Gamma), etc.  A given brain region communicates with other brain region over a range of frequencies. Currently available for Raw Values Only.

  • Surface Cross-Frequency Coherence is an EEG measure of the Coherence (amplitude independent coupling) between frequencies and scalp locations, for example delta & beta or theta & alpha-2 or theta & high beta (Gamma), etc.  A given brain region communicates with other brain regions over a range of frequencies.  This add-on quantifies the coupling and provides a normative database comparison (Z scores) to help link symptoms to dysregulation in the brain.

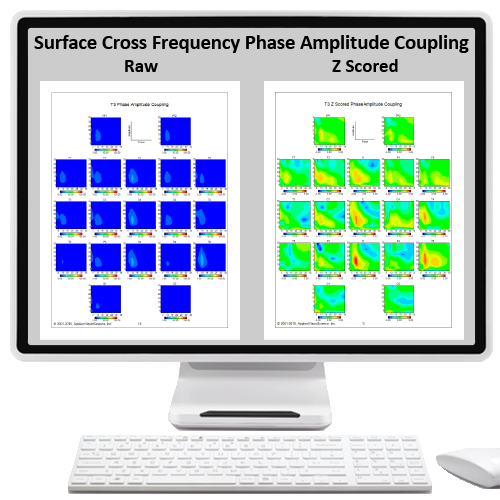
  • The amplitude of higher EEG frequencies (e.g., beta) are related to the phase of lower EEG frequencies (e.g., theta). Therefore, this is a surface EEG measure of the correlation between the phase and amplitude of the EEG across frequencies and scalp locations, for example delta and beta or theta and alpha-2 or theta and high beta (Gamma), etc. This is a unique and important metric that in part reflects the coupling between the upper cortical layers (I-III that generate beta) and the lower cortical layers (V-VI) that generate delta and theta. This add-on quantifies the coupling and provides a normative database comparison (Z scores) to help link symptoms to dysregulation in the brain.

Title

Go to Top