| DIS | | Discriminant Functions | $2,000.00 | | |
| NS | | NeuroStat | $700.00 | | |
| NB | | NeuroBatch | $700.00 | | |
| BPI | | Brain Performance Index | $1,500.00 | | |
| LOR | | LORETA Current Density Normative Database | $1,200.00 | | |
| LCP | | LORETA Coherence and Phase Differences | $1,200.00 | | |
| LPR | | LORETA Phase Reset | $1,200.00 | | |
| SC | | LORETA Source Correlation | $1,200.00 | | |
| ECL | | LORETA Effective Connectivity | $1,200.00 | | |
| CFC-L | | LORETA Cross-Frequency Coherence | $1,200.00 | | |
| BSV | | BrainSurfer Network Viewer | $1,200.00 | | |
| CS | | Connectivity Suite | $700.00 | | |
| BS | | Dynamic Bi-Spectral Analyses | $700.00 | | |
| ECS | | Surface Effective Connectivity | $700.00 | | |
| CFP-S | | Surface Cross-Frequency Power | $700.00 | | |
| CFC-S | | Surface Cross-Frequency Coherence | $700.00 | | |
| CFPA-S | | Surface Cross-Frequency Phase Amplitude | $700.00 | | |
| NF1 | | Surface 1 to 19 Channel Z Score Neurofeedback | $2,000.00 | | |
| NF2 | | 3-D sLORETA Z Score Neurofeedback | $2,500.00 | | |
| NF3 | | Surface 1 to 19 Channel Z Score Cross-Frequency Neurofeedback | $2,000.00 | | |
| swNFB | | swLORETA Z Score Neurofeedback | $3,000.00 | | |
| swXNF | | swLORETA Z Score Cross-Frequency Neurofeedback | $3,000.00 | | |
| Stream | | ANI Streamer | $350.00 | | |
| Surf | | BrainSurfer | $2,500.00 | | |
| swSurf | | swBrainSurfer | $3,000.00 | | |
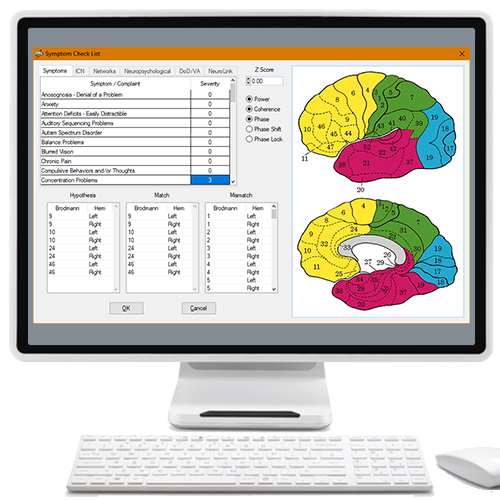
| SCL | | Symptom Checklist | $600.00 | | |
| NN | | NeuroNavigator | $3,000.00 | | |
| NNZ | | NeuroNavigator's swLORETA Current Source Density Normative Database | $1,200.00 | | |
| NNF | | NeuroNavigator's swLORETA Functional Connectivity Normative Database | $1,200.00 | | |
| NNI | | NeuroNavigator's swLORETA Effective Connectivity Normative Database | $1,200.00 | | |
| NNPR | | NeuroNavigator's swLORETA Phase Reset Normative Database | $1,200.00 | | |
| NNDTI | | NeuroNavigator's Diffusion Tensor Imaging Overlay | $1,200.00 | | |
| NNNS | | NeuroNavigator's NaviStat | $1,200.00 | | |
| ERP | | Evoked Potentials and Event Related Potentials | $1,500.00 | | |